How it works · Weigh it and decide

The model proposes. You decide.

You have the forecast for the Singel site: an expected figure, its range, and the reasoning attached. What you do with it is the part no model should own. IRIS hands you a report you can read, question, and act on. It does not hand down a verdict.

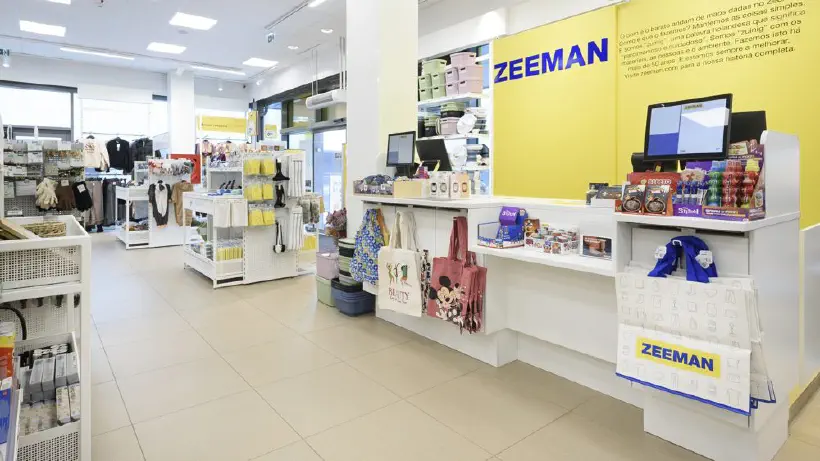
Illustrative sample: street-level view of the candidate storefront on the Singel, Amsterdam The Singel site

Nothing hidden

Open the number, and disagree with it

Every forecast comes with the demand drivers behind it, and every driver traces back to the signals that feed it. Click one, and IRIS shows its working. That is only possible because it uses a method you can open, not a black box: a transparent model your own expert can question and overrule is the correct answer, not a compromise. When you disagree for a real reason, change it, and the model still runs.

Control is the default here, not a setting you go hunting for.

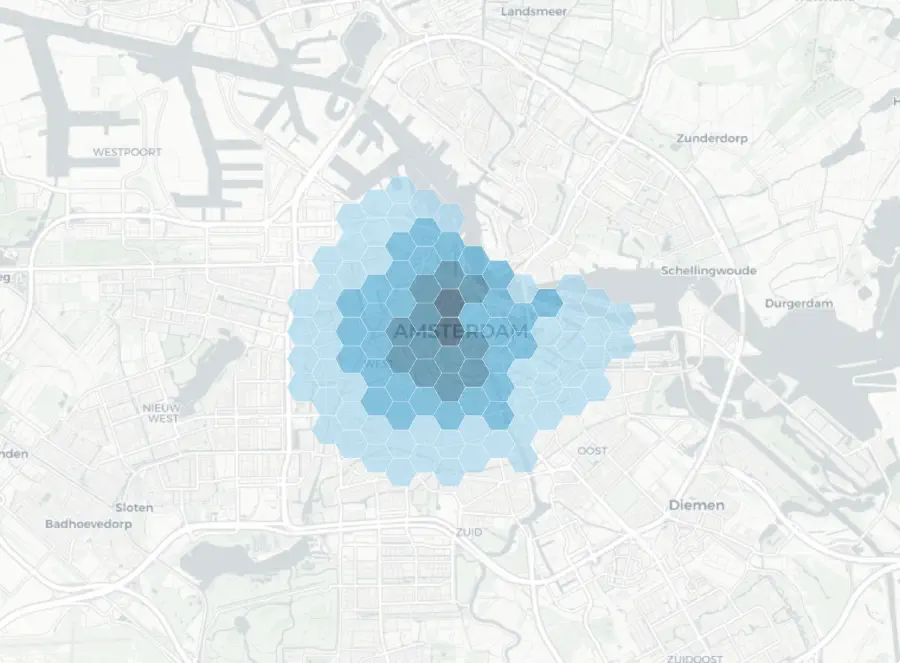
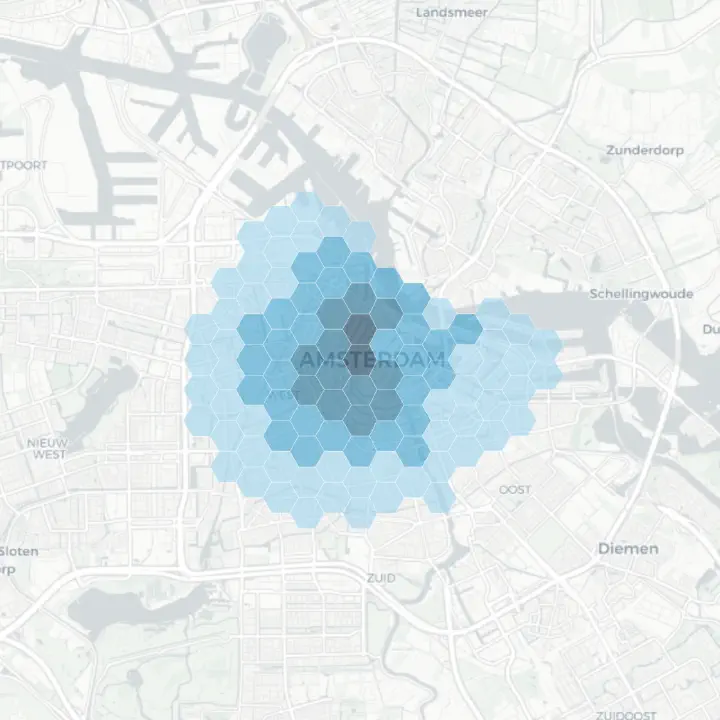
A catchment map for the Singel site in Amsterdam. Illustrative sample. Catchment

The one hard rule

Change the number only when it is wrong, never when it is inconvenient

A driver the model could not see, or a local fact in no data set: that is a good reason to overrule it. Wanting it higher to clear an ROI hurdle, or lower to ease a negotiation, is not. The moment a forecast bends to what you wish it said, it stops being a forecast.

Every opening tunes the next forecast

Worth more in year three than in year one

A forecast is the best call you can make before the doors open. It is not a promise reality has to keep.

Something the model never saw may still happen, and no honest tool pretends otherwise. Which is exactly why, once the Singel store opens, it reports back. Its real takings become one more of the stores you already know, and the next forecast for a site like it is grounded in one more true result. The model does not stand still while your estate grows; it is refitted to what your business actually does. And your results sharpen your model, not a shared pool, unless you choose to opt in, and then only contributors benefit. Every decision feeds the next, and the range tightens.

That compounding is why teams stay, and why 95% of the models we have deployed are still in production. That is a retention figure, not a model-accuracy claim.

See how the model is validated
every opening tunes the next forecast
1Forecast the site
2You open the store
3Real result ingested as labelled data
4Next refresh is sharper
feedback loop
How the 80% range tightens, refresh over refresh
Refresh 1Refresh 2Refresh 3
80% interval 99% interval point prediction

Illustrative.

In the real world

Calls other teams made with IRIS

The discipline is not theory. These are decisions real teams made with IRIS, and how they held up once the doors opened.

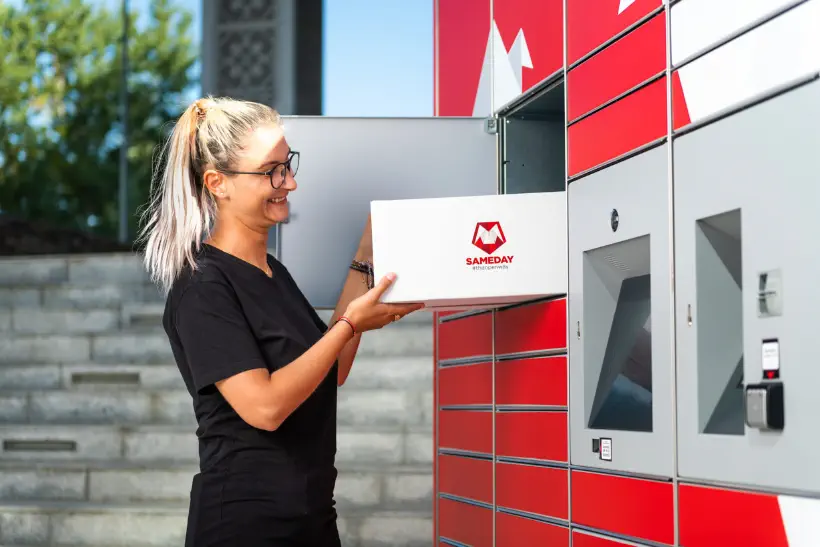
"The IRIS platform is now an essential part of our decision-making process. It allows us to test scenarios, predict outcomes, and ensure our growth is sustainable and aligned with market demand."

Gheorghe Marius Adrian, Easybox Business Director at Sameday

See it on your own estate

Keep the decision yours

Book a demo and read a live IRIS report end to end: the number, its range, and the demand drivers you can question, challenge, and change, with the model still running behind you.