Place embeddings · Step 2
The signals behind a place embedding
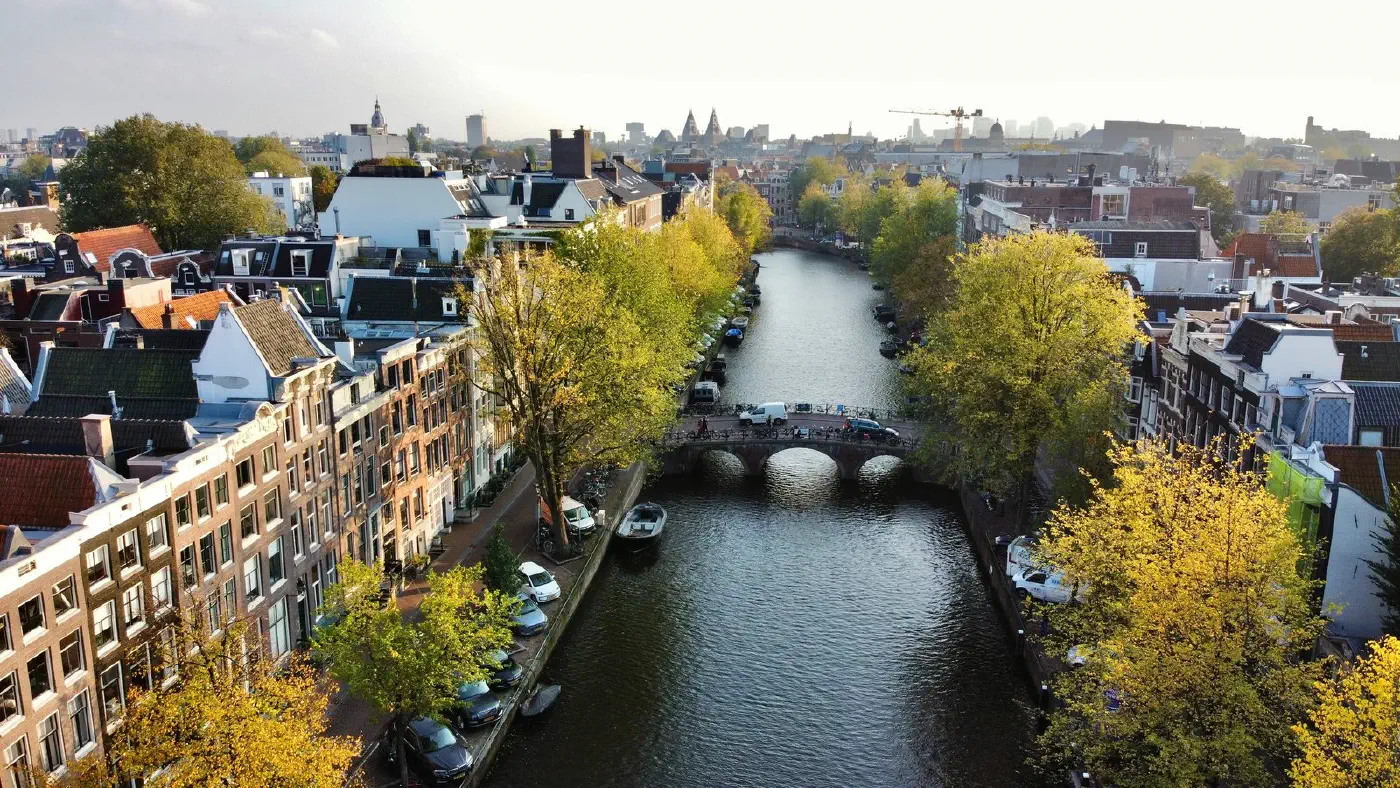
A place is not one thing, so IRIS does not describe it with one thing. Under every 120-metre hex sits more than 100 signals: who lives there and who works there, how many people pass through and by what means, what is nearby, how the buildings are arranged, how busy the roads are, and much more. Each of those signals is a full map in its own right. Population is a map. Daytime workers is a different map. Footfall along a corridor is another. Only after all of them are laid over the same ground does IRIS combine them into the single embedding.
Two kinds of signal
The signals come from two places. The first is satellite: a set of learned bands derived from years of satellite imagery that describe the physical fabric of a place, its built form, vegetation, surfaces and how they change through the year. That is a real input, not an analogy. Roughly sixty of the signals are these satellite bands.
The rest, around seventy more, IRIS computes itself from open and licensed data: population and daytime population, movement and access, the mix and density of amenities, the shape of the street network, and so on. Add the two together and you are past a hundred signals for every hex, which is why we describe it as "more than 100" rather than a precise-sounding single number.
Satellite
Learned satellite bands
Learned bands derived from years of satellite imagery, describing the physical fabric of a place: its built form, vegetation, surfaces and how they change through the year.
Computed
Open and licensed data
Population and daytime population, movement and access, the mix and density of amenities, and the shape of the street network, computed by IRIS itself.
Combined
One vector per hex
Laid over the same ground, aggregated to the hex and k-anonymised, they become the single embedding. Nothing in the vector is about an individual.
Every signal IRIS reads is a map in its own right. The embedding is what you get when you read them all at the same time.
Each signal is its own map. IRIS reads them together.
Every signal IRIS ingests is a map in its own right, laid over the real ground it describes. Here is the same small region, one channel at a time, before any of them are combined.
and more than 100 in all, combined into one IRIS embedding. Illustrative: the six maps and the aerial backdrop are examples, not measured data.
Why read them together
The reason to combine signals rather than rank them is that a place's character lives in the combination. Dense-by-day with a heavy commuter flow and a tight amenity mix is a different kind of place from dense-by-day that is mostly residential, even if a single population figure looks identical. A human analyst reads a location the same way, glancing across several maps at once and forming an impression. The embedding is the machine version of that impression, held as numbers so it can be compared consistently from one city or country to the next.
Where the signals come from, and what they are not
The base layer is built from trusted open sources, so a client invests in the value added rather than in re-buying data that already exists. Premium and surveyed sources are added only where they change the answer for a specific question, and coverage is deepest where the ground truth is, which for the Benelux is dense and well surveyed. That depth is a capability claim, that IRIS can model these markets well, not a flag to wave.
One reassurance for procurement, said once: the embeddings process no personal data. Everything is aggregated to the hex and k-anonymised, so there is nothing about an individual in the vector, only the character of the ground.
More than 100 signals in, one short vector out. The next question is how IRIS turns that stack of maps into the eight numbers, and how it learns which arrangement is the right one.