Place embeddings · Step 4
Why a hexagon grid
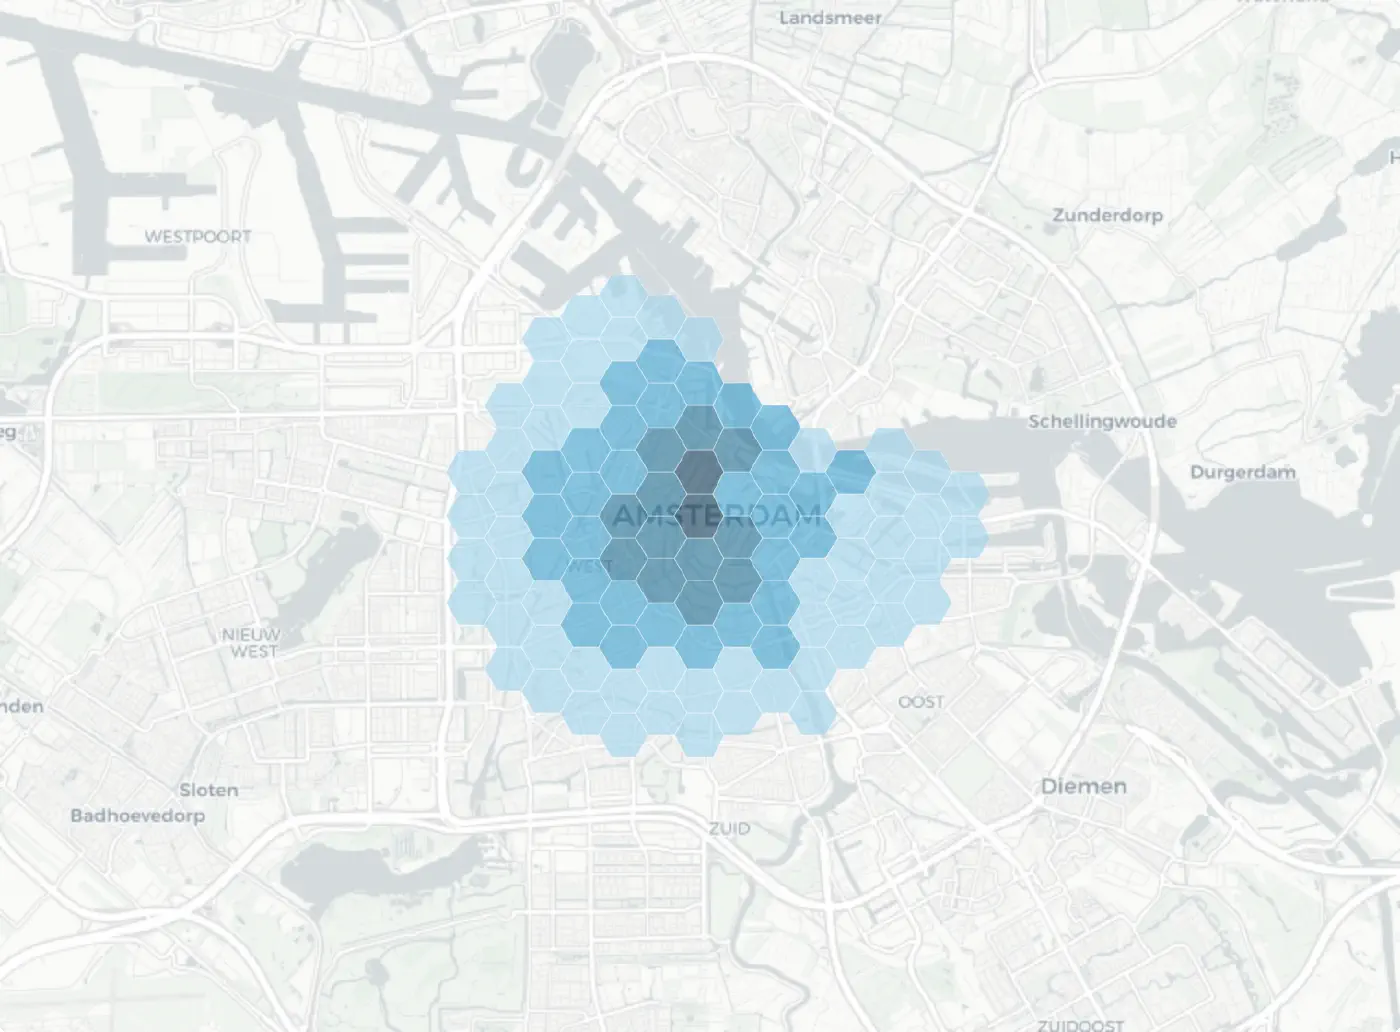
Before you can compare two places, you have to agree on what a "place" is. IRIS settles that by laying one grid over the whole modelled map and learning a vector for each cell. The grid is made of hexagons, each about 120 metres across, and there are tens of millions of them. The shape of that cell is a deliberate choice, and it matters more than it first appears.
Why not squares
The obvious grid is a grid of squares, like pixels. The problem is neighbours. A square has eight neighbours, but they are not all the same distance away: the four that share an edge are closer than the four that meet only at a corner. So "next to" means two different things depending on which way you look, and any measure of "what surrounds this cell" inherits that inconsistency.
A hexagon fixes this. Every hexagon has exactly six neighbours, and every one of them shares a full edge at the same distance. "Next to" means one thing. When IRIS reads the surroundings of a cell, or nudges similar cells together during training, that even neighbourhood keeps the geometry honest across millions of comparisons.
A square has neighbours at two different distances. A hexagon has six neighbours, all the same. When you are comparing millions of places, that even geometry is what keeps it fair.
| A square grid | A hexagon grid |
|---|---|
| Eight neighbours, at two different distances | Six neighbours, every one the same distance away |
| 'Next to' means two different things | 'Next to' means one thing |
| Any measure of the surroundings inherits that inconsistency | The neighbourhood stays even across millions of comparisons |
A fair grid for the whole continent.
A hexagon gives every place a near-equal-area cell with the same six neighbours, so comparisons stay fair from one city or country to the next. Squares distort as you cross the map and their diagonal neighbours sit further away than their edge neighbours. IRIS lays a single hexagon grid over the whole modelled map: tens of millions of cells, street level, every place measured the same way.
What "near-equal-area" honestly means
You will sometimes see grids like this described as equal-area. That is not quite true, and the distinction is worth getting right. IRIS uses Uber's H3 grid at resolution 10. H3 is built by projecting hexagons onto a sphere, and because you cannot tile a sphere with perfect hexagons, cell area varies a little across the map and the construction includes a small number of pentagons globally. So the honest word is near-equal-area: close enough that a comparison between a cell in one city and a cell in another is fair, but not identical to the last square metre.
We say near-equal-area rather than equal-area on purpose. The teaching point, that a hexagon gives every place a comparable cell with the same six neighbours, survives the correction. The false precision does not, and a reader who knows the grid would catch it.
One grid, one method, everywhere
The payoff of a single continent-wide grid is consistency. Every place is measured the same way, at the same resolution, with the same neighbourhood rule, whether it sits in Amsterdam or on the edge of a smaller town. That is what lets IRIS line up a proposed site against real locations elsewhere and trust that "similar" means the same thing in both.
- Grid: Uber H3, resolution 10.
- Cell size: about 120 metres across.
- Shape: near-equal-area, six equidistant neighbours.
- Scale: tens of millions of cells across the modelled map.
A fair grid, laid once, so that every place carries a vector you can compare to every other. With the vector, the signals, the training and the grid in place, the last question is the useful one: how does all of this become a forecast you can act on.