Last-mile and micro-fulfilment

Grow your network where the coverage is genuinely new.

Placing a locker, micro-hub or EV charger in the wrong spot is expensive to undo. IRIS forecasts the demand and the population each candidate site actually reaches, separates genuinely new coverage from what you already serve, and shows the effect on the rest of your network before you commit.

  • Forecast reach and demand for every candidate locker, micro-hub or EV charger
  • Split genuinely new coverage from demand you already serve
  • See the effect on the whole network before you sign
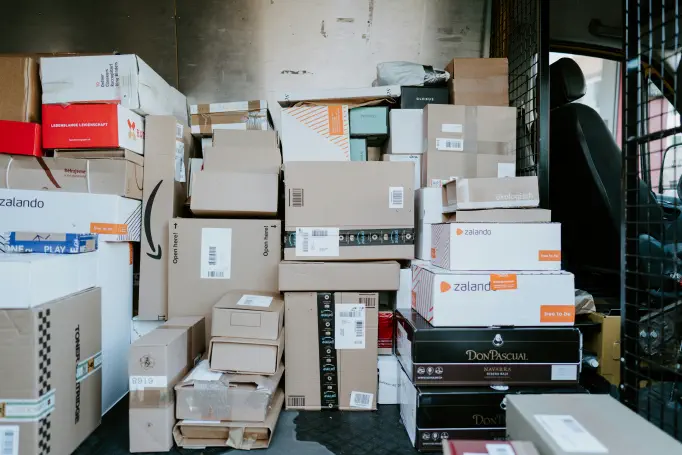
The inside of a delivery van packed with parcels ready for a last-mile round, from many different senders.

Find the coverage gaps

See where your network leaves demand unreached

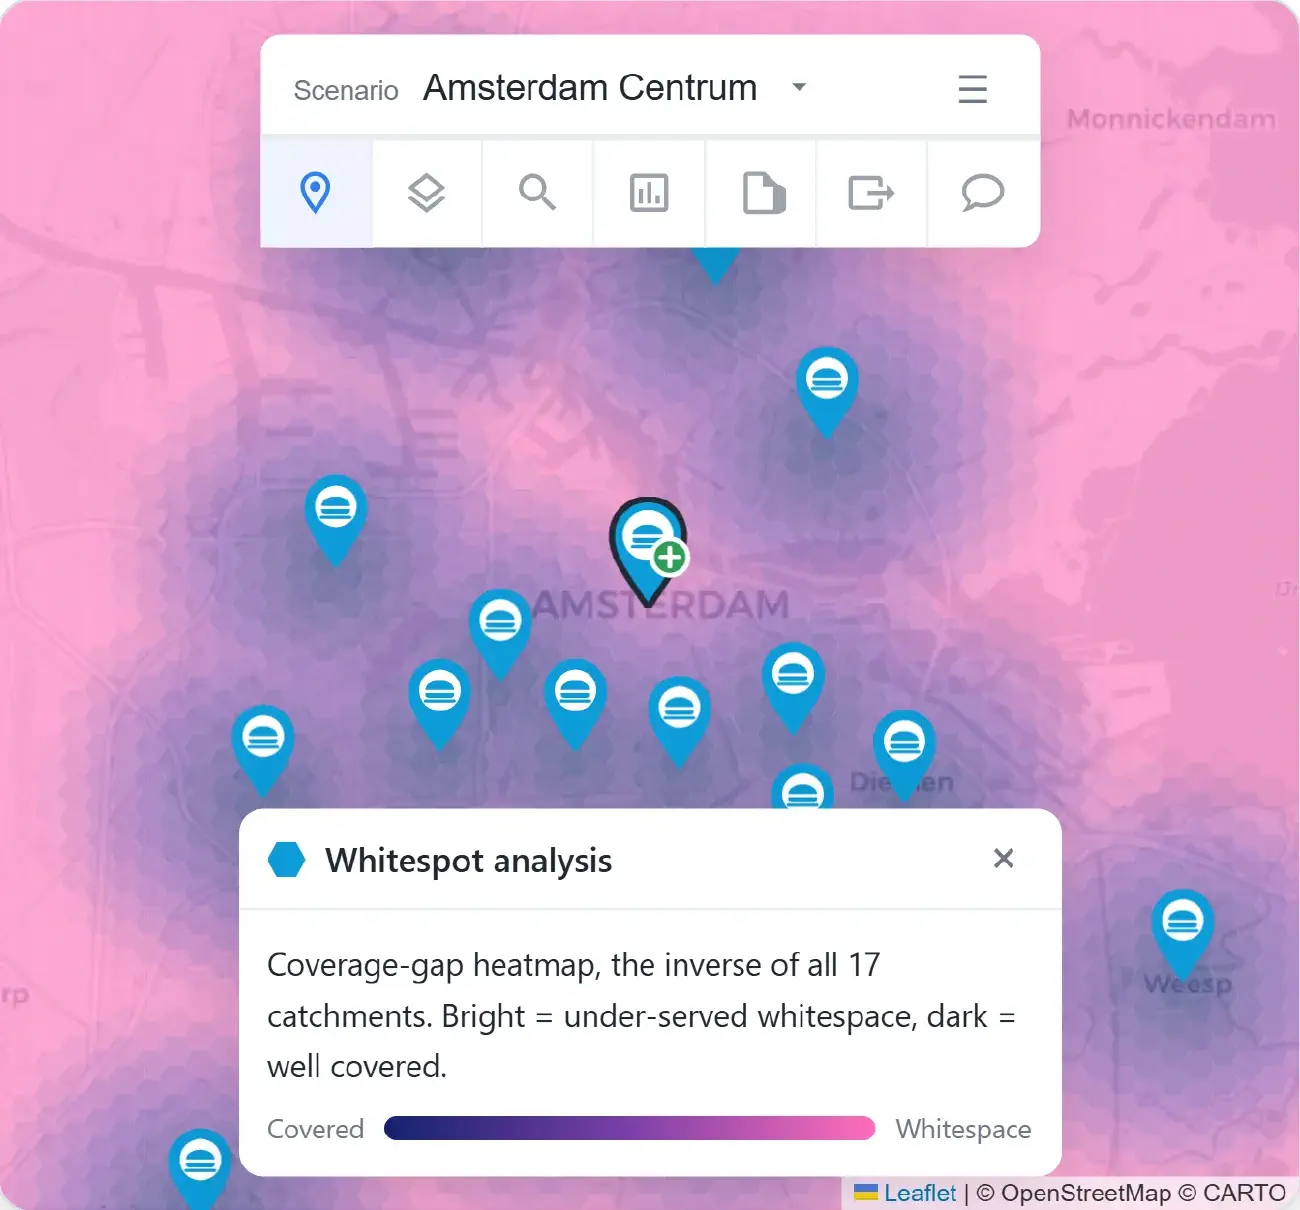
A cheap unit in a well-covered street adds cost, not reach. IRIS maps the demand your network already serves, then surfaces the neighbourhoods where reach is still thin, so you shortlist the gaps that actually move coverage instead of the sites the rent makes tempting.

  • A white space map of demand your network has not reached yet
  • Rank candidate neighbourhoods by unserved demand, not by how busy they look
  • Fill the gaps in the order that adds most coverage per site
IRIS coverage-gap map of Amsterdam: a pink-to-dark heatmap where bright areas are under-served demand and your existing lockers and hubs are pinned, with a white-space analysis panel open. Illustrative sample on Amsterdam data.
IRIS coverage-gap (white-space) analysis. Illustrative sample on Amsterdam data.

Add coverage, not overlap

Add reach that is genuinely new, not demand you already serve

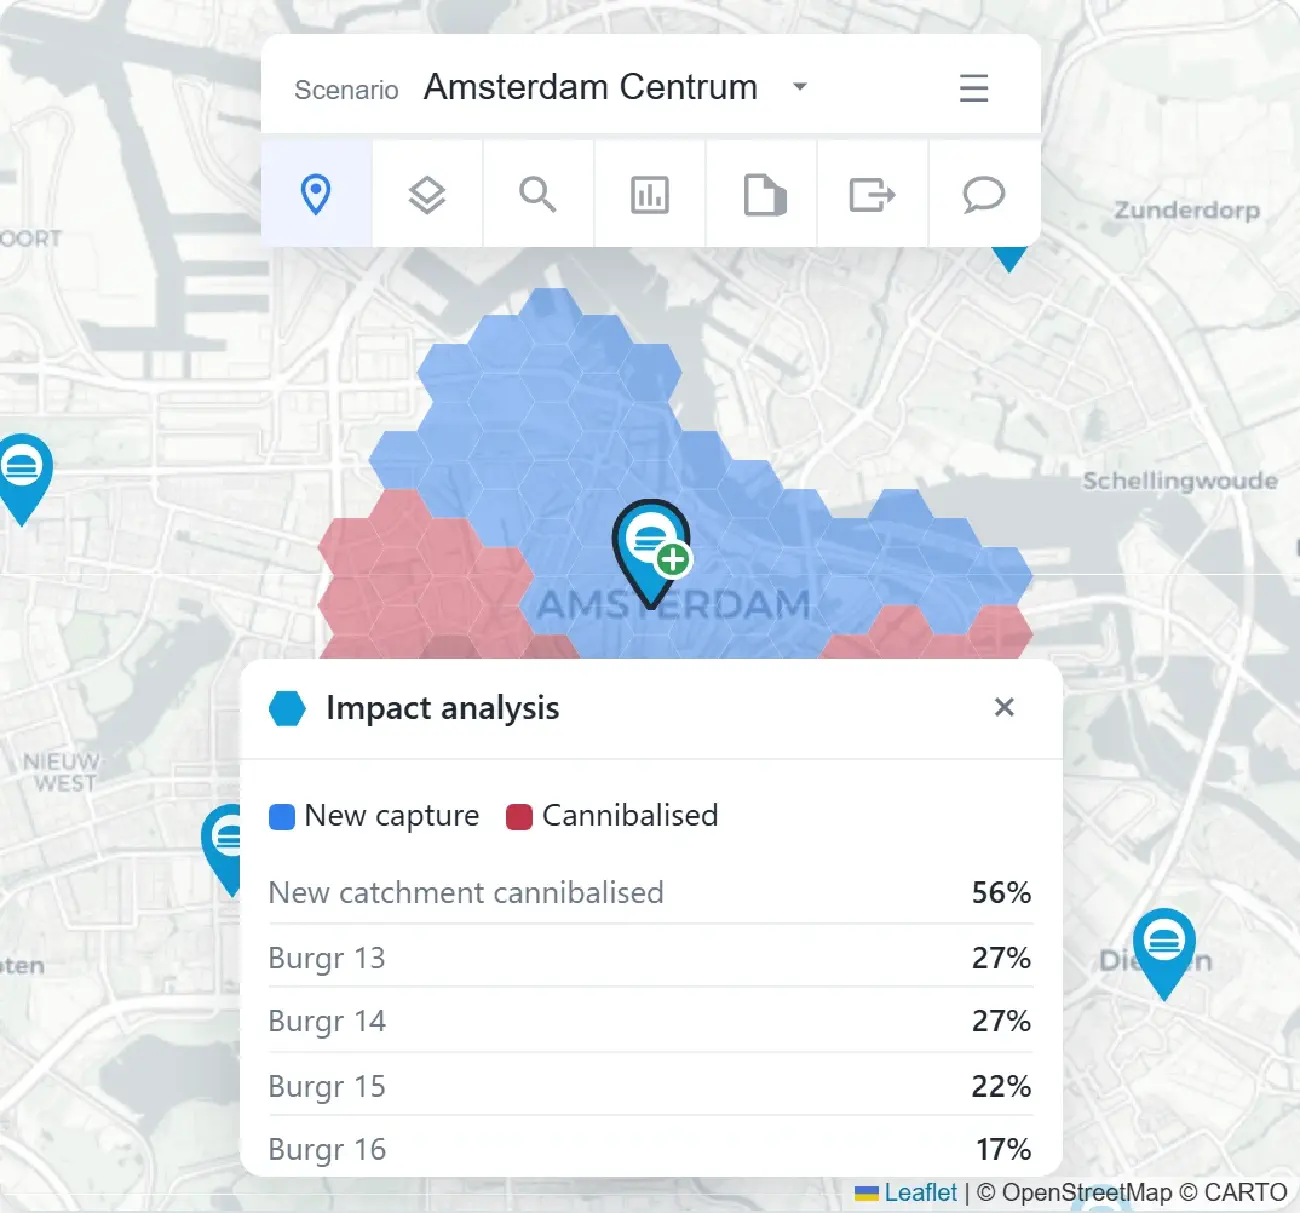
A new locker that mostly serves parcels an existing hub already reached adds cost, not coverage. IRIS forecasts how much of a candidate site's demand is genuinely new versus pulled from points you already operate, so you can weigh the real gain to the network before you sign anything.

  • See what share of a site's demand is genuinely new
  • Model the moves together, and watch the coverage redraw
  • Weigh the net gain to the whole network before you commit
IRIS impact analysis for a candidate Amsterdam locker: blue hexes mark newly reached demand, red hexes mark demand pulled from nearby sites you already run, and a panel lists the transfer per existing site. Illustrative sample.
IRIS impact analysis: new reach in blue, overlap in red. Illustrative sample.

Reach on real travel time

Measure reach on how people travel, not a radius on a map

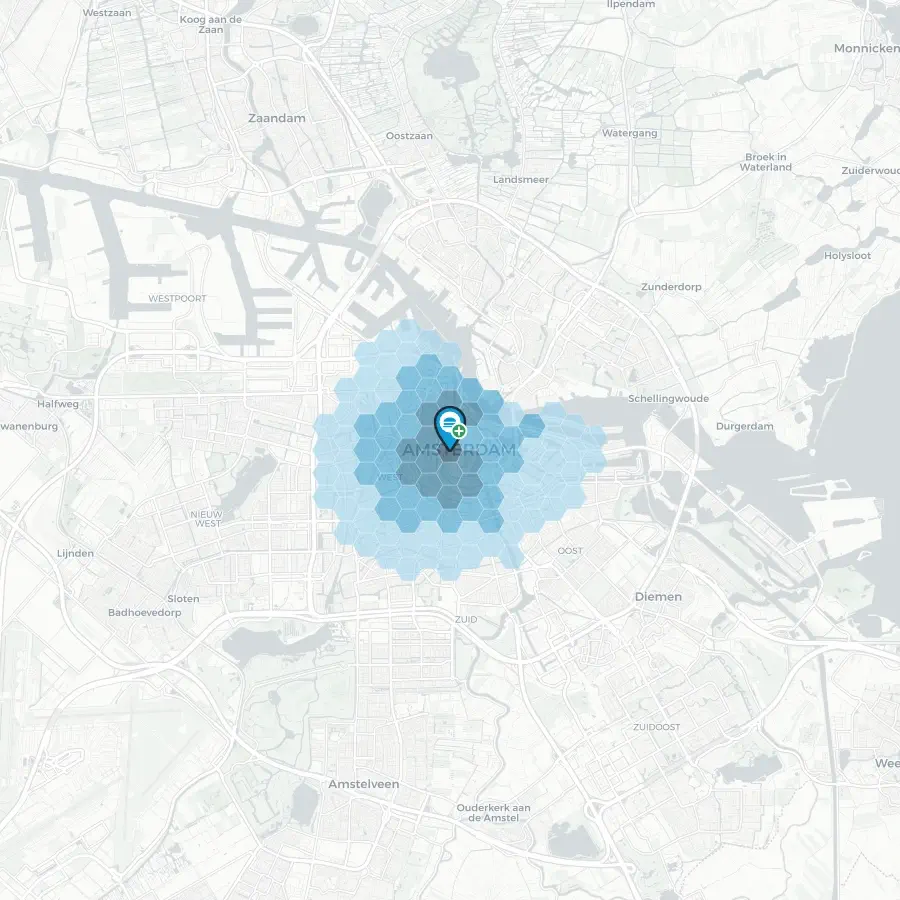
A locker within a short walk, a micro-hub inside a van round, an EV charger on the right commute: reach is about how people actually move, not a circle drawn on a map. IRIS measures the population each site reaches on genuine travel time, so you know the reach before you sign, not after the first slow round.

  • A reach catchment measured on real walking, cycling and van time
  • See where two sites' reach overlaps, and where it leaves demand unserved
  • Match the mode to the job: walk, van round or commuter flow
IRIS travel-time catchment around a candidate Amsterdam site: reach hexes densest at the site and fading outward, shaded by how much of the population each ring reaches. Illustrative sample on Amsterdam data. Illustrative sample

Proof

Sited where reach held up, not where the rent looked cheap

Sameday used IRIS to test candidate Easybox sites against forecast demand and the population within reach, then tested relocations and new openings before committing. Every candidate is first held against locations you already run, so you can judge the fit before you sign, not after.

Sameday · Easybox

A network sited on where demand and reach held up

Sameday scaled its Easybox network with IRIS testing candidate sites against forecast demand and the population within reach, rather than where a unit was cheapest to secure.

6,000+
Easybox lockers and pickup points, as Sameday scaled its network with IRIS. Sameday, 2024.

Reach, not a hunch

Coverage measured as people within a short walk

Each candidate site reports the share of the local population within a 7-minute walk, so accessibility is a figure you can defend to the board, not a claim about a busy street.

50%
of the population within a 7-minute walk, the Easybox coverage target.

See it on your own coverage

Add coverage where it is thin, not where it already overlaps

Book a demo and we will run IRIS on your own network. Or start with a Validation Sprint: we score sites you already run, kept back from the model, so you can see where reach is genuinely thin before you install the next one.