For retail chains

Grow your chain store by store, and defend every opening.

You are opening, relocating and refitting stores across markets, and every one of those calls has to survive a board that has watched forecasts miss before. IRIS scores each candidate site, forecasts its revenue with an 80% interval, and shows how a new store would draw demand from the ones you already run, so you can grow the estate without quietly cannibalising it.

A retail store checkout, an assistant handing a customer their shopping bag

Start with what you run

Benchmark the stores you already run

Before you weigh a single new lease, IRIS scores the estate you already own on the same model it uses for candidate sites. You see which stores are punching above their catchment and which are quietly underperforming the demand around them, each with the reasoning attached.

It is the lowest-commitment way to see what the model sees: no new sites, no forecast to defend yet, just an honest, ranked read on the network you already run.

A catchment map for an existing store in Amsterdam. Illustrative sample. Existing store Sample

Where to grow next

Find the white space in your network

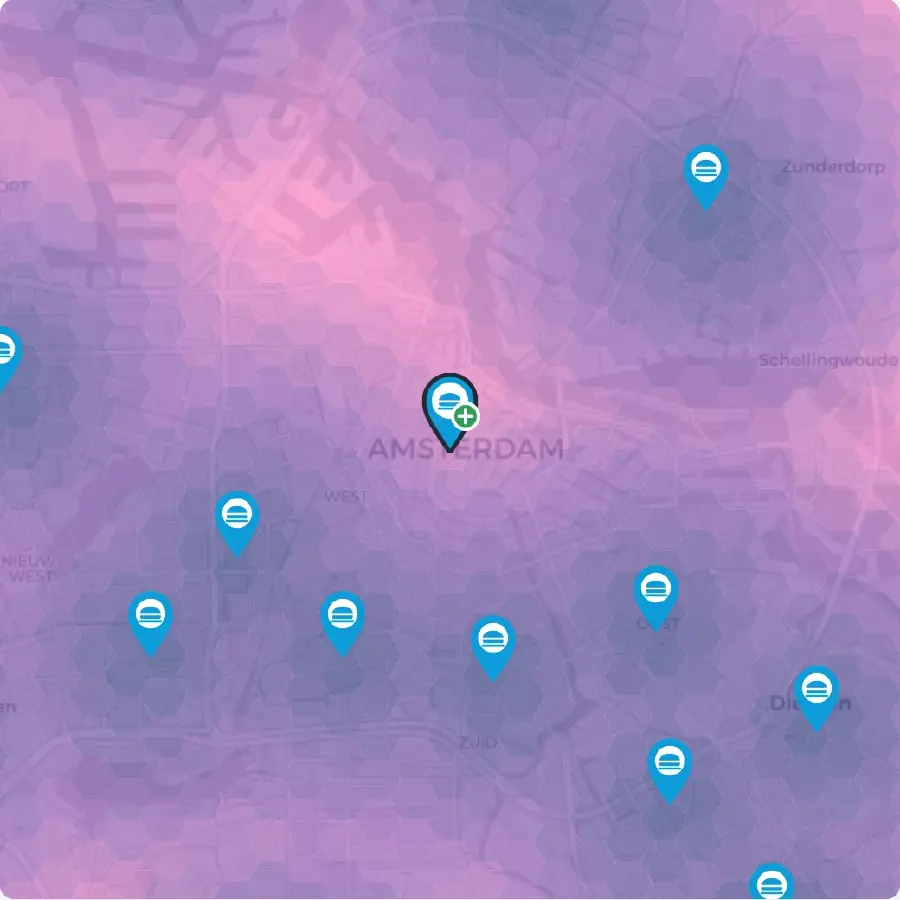
Broker lists and last year's rule of thumb do not scale to an estate. IRIS maps demand against your current coverage and lights up the white space: the catchments that could support a store you have not opened yet, and the ones you already serve to saturation.

Each candidate is scored on more than 100 local signals, including purchasing power, household composition, footfall and competitor pressure, drawn from 22M+ points of interest. You walk into the investment committee with a ranked shortlist of gaps instead of a hunch, and with the reason each one sits where it does.

  • Every candidate scored on 100+ local signals, from footfall to competitor pressure
  • A coverage-gap map of the catchments your network has not filled
  • A ranked shortlist for the investment committee, with the reason for each
IRIS coverage-gap (white-space) map of Amsterdam: bright areas are under-served white space, darker areas are already well covered by the stores you run, each pinned. Illustrative sample. Illustrative sample

What the board sees

One number, its interval, and where it ranks

IRIS never hands you a single figure to defend on its own. Every site comes back with a forecast, the 80% interval around it, and the drivers behind it, so you can size the downside before you commit the capital. The interval widens in new markets and thin store counts, and IRIS shows you when it does rather than flattering the forecast.

Most of the time the number you actually act on is not the euro figure, it is the rank: where this site sits against the stores you already run. A site that comes back third in your own estate is a far easier call to take to the board than an absolute figure nobody can sanity-check.

€1.20M€1.0M€1.4M€0.80M€1.60M
Sample
80% interval99% intervalpoint prediction
Ranked against your own estateSample
1 Zuidas flagship €1.6M
2 Rotterdam Centrum €1.4M
3 Amsterdam Centrum €1.20M
4 Utrecht Binnenstad €1.1M
5 Den Haag Spui €0.9M

Illustrative sample. Location scores 0–100 and revenues shown for a fictional estate.

Who is in the catchment

Who is in reach, not just how many

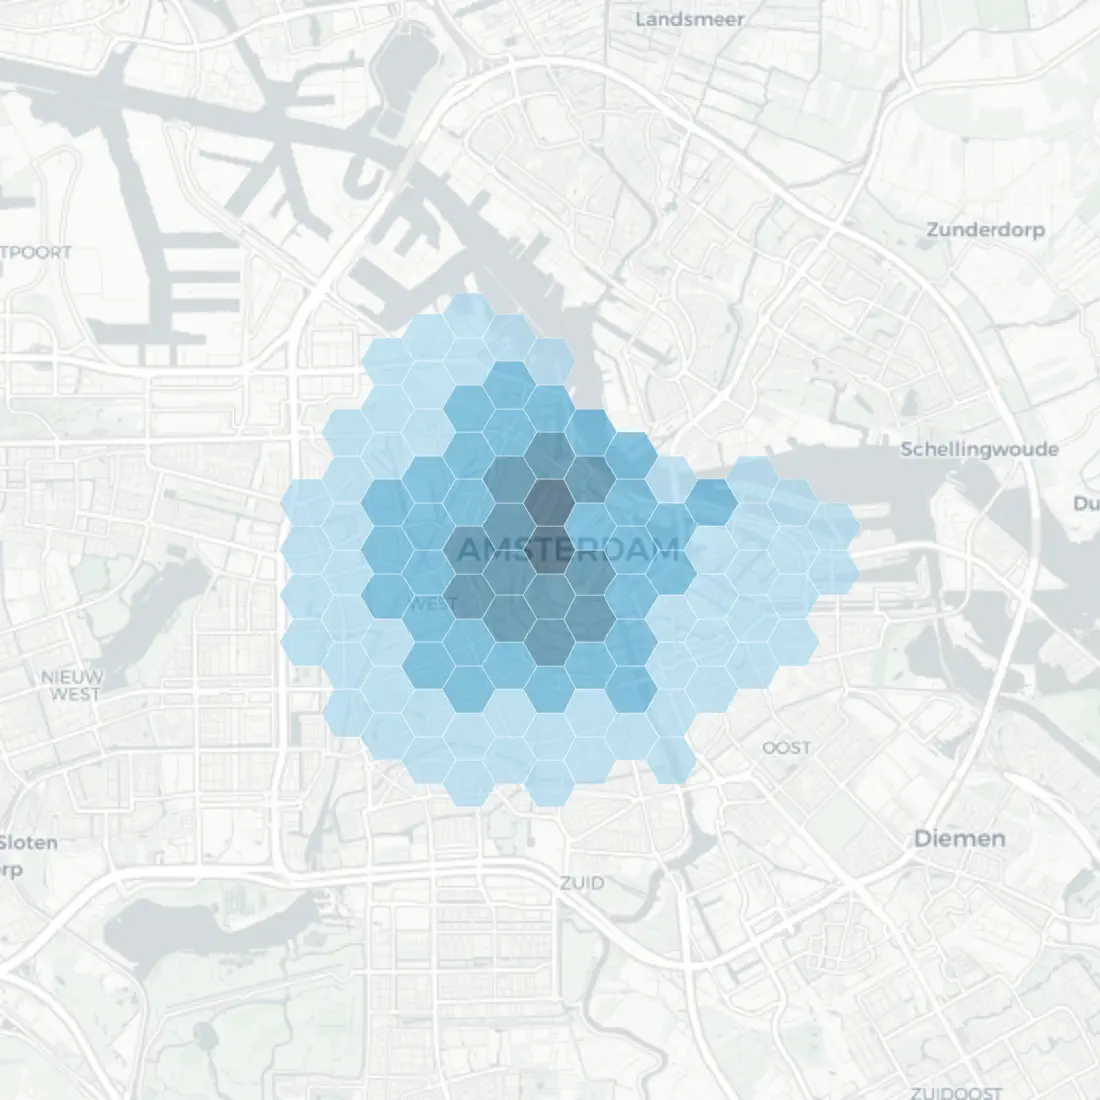
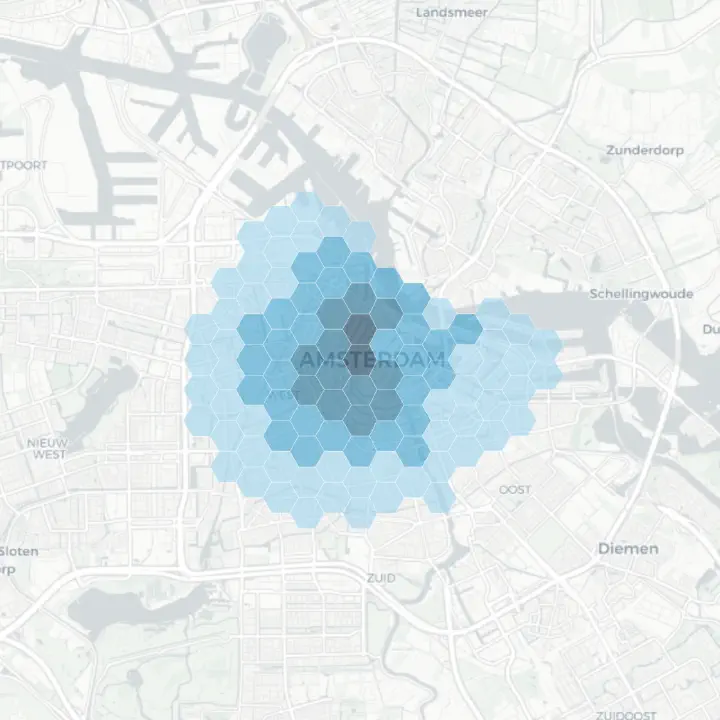
A headcount does not tell you what to stock. IRIS breaks each catchment down by what actually drives demand, residential, work and school, shopping, leisure, passing and tourism, and by who those people are: income, education, age and the month they turn up.

That is what lets you align a store's assortment and inventory to the demand around it, instead of shipping the same planogram to every postcode and hoping.

IRIS catchment map around a store in Amsterdam, with the site marker and its travel-time catchment drawn over the surrounding streets. Illustrative sample. Illustrative sample

Expand, relocate, consolidate

Optimise the whole network, not one store

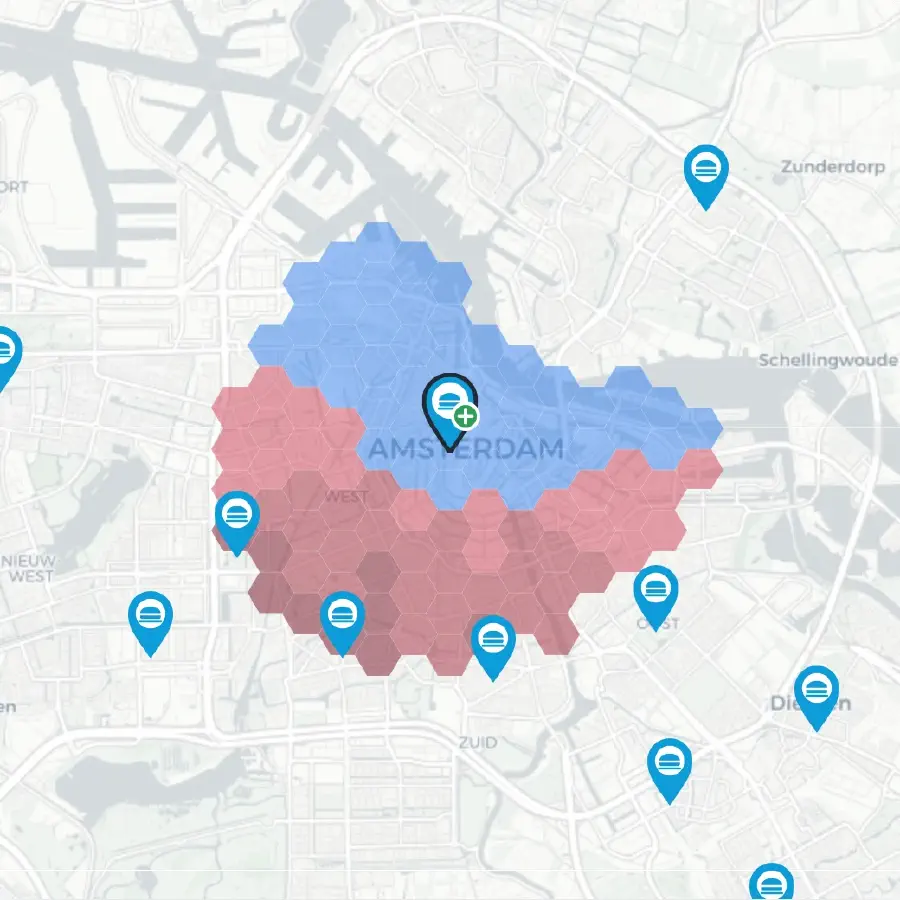
Growth is not one store, it is the estate. Before you open or move a site, IRIS models how much demand it would pull from the stores you already run, and flags which locations to expand, refurbish, relocate or consolidate against live market data.

You weigh the net gain to the network, not the headline of a single site, and you stop paying to move revenue between your own stores.

  • See what share of a new store's catchment is genuinely new
  • Weigh the net gain to the whole estate before you commit
  • Model openings, relocations and closures together, and watch the catchments redraw
IRIS impact map for a candidate Amsterdam store: blue hexes mark newly captured catchment, red hexes mark demand cannibalised from nearby stores you already run. Illustrative sample. Illustrative sample

Proof, not a scenario

A retail chain already plans this way

Everything above uses an illustrative Amsterdam site so the method is visible. The method itself is already running on a real estate: Zeeman, a retailer with close to 1,400 stores, plans its store network with IRIS across 6 European markets, evaluating hundreds of scenarios in one shared framework, with the judgement of the people who know the stores still in the room.

Before 2019 those calls were made on intuition. They are now made on a model the team can open and argue with, which is the same shift this page describes.

Read the Zeeman case study

Ready when you are

Grow the estate on numbers you can defend

See IRIS run on your own stores and candidate sites. We will score the estate you already run, forecast a site you are weighing, and show you the reasoning behind every number, before you commit to anything. When you want that proven rather than shown, a Validation Sprint puts our error on your own stores, from €4,000 for the Kick Start.