How the model works
How the forecast is built, and how we check it
Every step opened up, including where it is weakest.
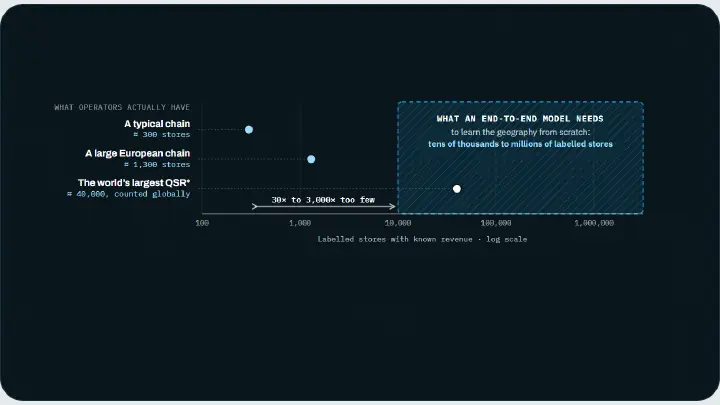
Site selection was never an AI problem
Why a bigger model is the wrong answer for store-revenue forecasting, and why the hard part is honest data, a method you can open, and enough labelled stores to learn from. The thesis behind IRIS.
Read · 5 min
The science IRIS is built on
The IRIS forecast is a spatial-interaction model from the Huff lineage that retail geography has tested since the 1960s, applied with modern data. Not a proprietary AI novelty, but a tradition that predates and outlasts the hype cycle.
Read · 4 min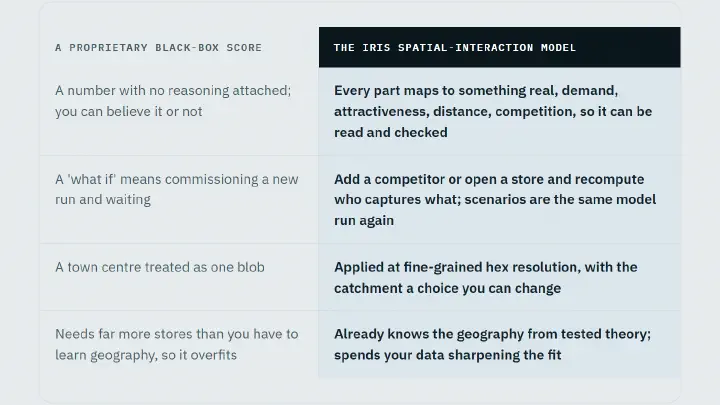
The gravity model behind the number
The forecast is a spatial-interaction model, not an AI that hands down a number. How a century-tested gravity structure, fitted to your own estate, produces a forecast you can read, question, and re-run.
Read · 4 min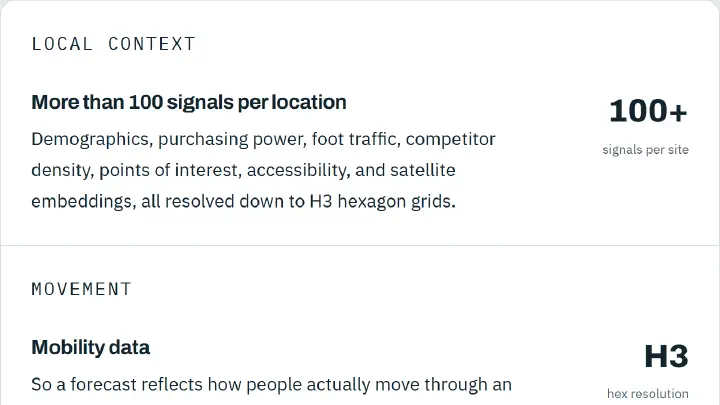
What actually goes into a forecast
Every IRIS forecast blends more than 100 local signals with your own store performance, resolved to fine-grained hex grids. What the four kinds of evidence are, and how they become demand drivers you can read.
Read · 4 min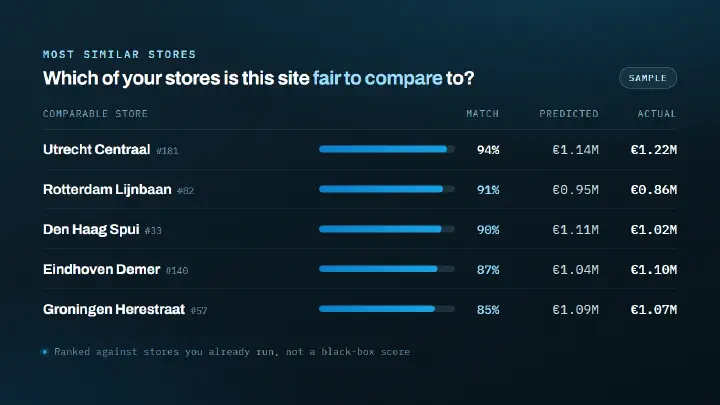
What makes two sites comparable
Every forecast is, at bottom, a comparison to stores you already run. So the real question is which stores are fair to compare. The vocabulary behind it: five trade-area types, and the grade of a site.
Read · 4 min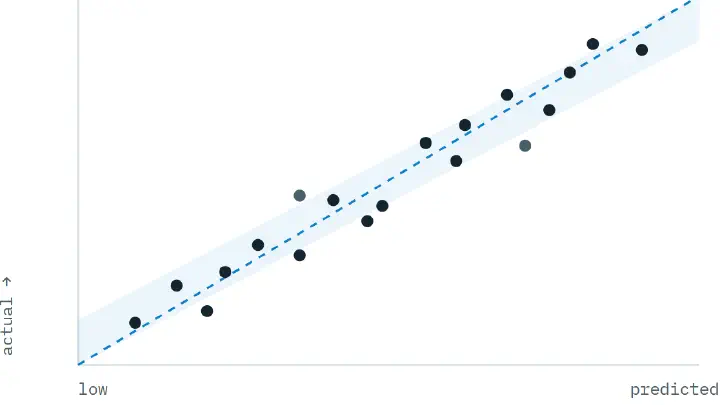
How IRIS validates a forecast out of sample
Validation means forecasting real openings with only the information available before they opened, then comparing to what happened. How IRIS reads a holdout three ways, and why coverage is the meta-test.
Read · 5 min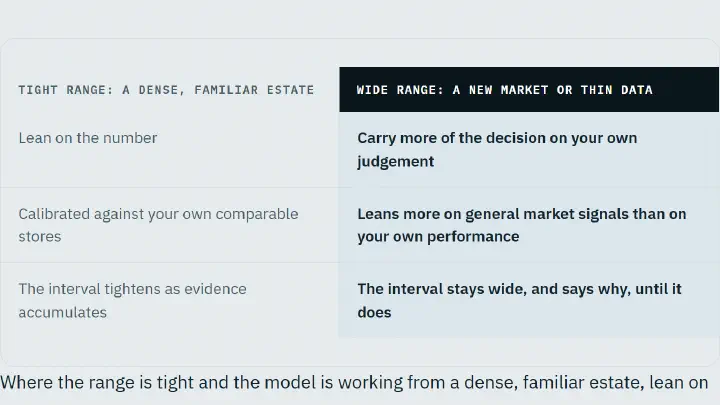
Where the model is weakest
An honest account of where an IRIS forecast should be trusted least: new markets, tiny estates, fast-moving competition, sparse data, and brands that change format from site to site. And why stating limits is a sign of a model worth trusting.
Read · 4 min